mail

Monthly Economic and Investment Outlook

May 2024 Economic and Investment Outlook

United States

stock market bull statue
  • Q1 2024 real GDP grew at an annualized rate of 1.6%, approximately half the pace of Q4 2023, and below the Fed’s forecast for 2024 of 2.1%. Volatile components, like trade and inventories, which often swing up and down in consecutive quarters, significantly impacted the slowdown.
  • The Bureau of Labor Statistics (BLS) reported that 175k nonfarm payroll jobs were created in April, below consensus of 240k. The unemployment rate increased to 3.9%, from 3.8% the previous month. April marked the 27th consecutive month that the unemployment rate was below 4%. Average hourly earnings (AHE) rose 3.9% y/y, down from 4.1% y/y in March. The jobs report was well received by the markets, as it showed the first downside surprise in payrolls in several months, as well as a dip in AHE growth.
  • Piper Sandler points out that near-term inflation stubbornness is driven by what consumers “need” or non-discretionary items, such as auto insurance and healthcare. Their CPI non-discretionary basket is running at 6.3% y/y (versus just 0.6% for discretionary items), acting like a tax, and crowding out discretionary spending.

    PSC Core Non-Discretionary CPI 
    Source: Piper Sandler
     

  • March’s headline Personal Consumption Expenditure (PCE) price index rose 2.7% y/y, compared to 2.5% in February. Core PCE, excluding volatile food and energy prices, remained unchanged at 2.8% y/y, from the previous month.
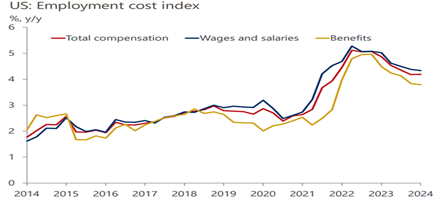
  • The Employment Cost Index (ECI), which measures changes in total compensation costs, including wages, salaries, and benefits, rose 1.2% q/q, and 4.2% y/y, unchanged from Q4 2023. The headline ECI for union and nonunion workers rose 5.3% and 3.9% y/y, respectively. Wages and salaries rose 6.3% and 4.1% y/y for union and nonunion workers, respectively.


    US Employment Cost Index
    Source: Oxford Economics/Haver Analytics
       

  • Economic activity in the manufacturing sector contracted in April, after one month of expansion, following 16 consecutive months of contraction. The U.S. ISM Manufacturing PMI fell to 49.2% in April, from 50.3% the previous month. New orders, backlogs, employment, raw materials inventories, and export all contracted. The prices index increased to 60.9% from 55.8% in March, the fastest pace since July 2022.
  • April’s University of Michigan’s consumer sentiment reading fell for the 3rd straight month, touching a 21-month low because of the high cost of food and gas and worries about the job market.

Global

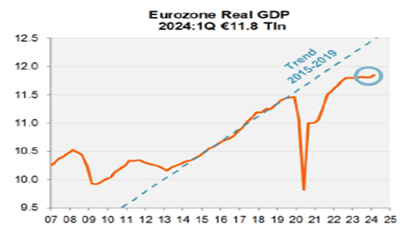
  • The Eurozone’s Q1 real GDP growth rate was 0.4% y/y, after two consecutive quarters of contraction during H2-2023. Q1’s growth rate was the best since Q3 2022. However, the Eurozone’s real GDP is still nearly 5% below its pre-covid trend.

    Eurozone Real GDP
    Source: Piper Sandler
          

  • Germany and France, Europe’s two largest economies, both grew by 0.8% during Q1, while Italy and Spain posted growth of 1.2% and 2.8%, respectively.
  • Eurozone PMIs came in better-than-expected last month on service-sector strength. The Global service sector PMI in France jumped from 48.3% to 50.5%, and in expansion territory for the 1st time in 11 months. The service sector PMI in Germany reached 53.3% from 50.1% the previous month, and the best result in 10 months.
  • The Eurozone Consumer Confidence Indicator rebounded from a record-low -28.6% during September 2022 to -14.7% last month. It should be noted that this indicator has been negative since 1985, a possible reflection of European’s pessimistic overall outlook.
  • Eurozone April’s flash headline CPI of 2.4% y/y was unchanged from the previous month, remaining close to the European Central Bank’s (ECB) 2% inflation target. Core CPI slowed to 2.7% y/y from 2.9% in March. In addition, the Eurozone’s services CPI slowed to 3.7% from 3.9% in April, from 4.0% in March.
  • The 6.5% jobless rate in the Eurozone remains at record lows, and at the same level since November 2023. Among the larger Eurozone member nations, unemployment in Germany held steady at 3.2%, while in France, Italy, and Spain, the unemployment rate ticked lower to 7.3%, 7.2%, and 11.7%, respectively.
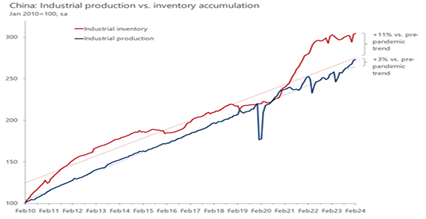
  • China’s Q1 real GDP grew 5.3% y/y, primarily due to strong industrial output and exports. However, it appears China is facing excess capacity, which could pressure China’s future growth. Manufacturing capacity utilization dropped to 73.8% in Q1, its weakest level excluding the pandemic- affected Q1 of 2020, since 2015.
  • China is facing a problem of demand weakness, rather than sharp oversupply, resulting in excess industrial inventory accumulation.

    China Industrial Production
    Source: Oxford Economics/NBS
       

Fixed Income

  • As expected, the Federal Open Market Committee (FOMC) left the federal-funds target policy band unchanged at 5.25% to 5.50%, at its most recent meeting. The statement from the central bank’s policy arm noted that the “lack of further progress toward the Committee’s 2% inflation objective,” precludes any near-term cuts.
  • Chairman of the Federal Reserve Bank, Jerome Powell, commented during the press conference after the FOMC meeting, “I think it’s unlikely that the next policy rate move will be a hike.” Easier policy (rate cuts) would depend on inflation coming down on a sustainable path toward the Fed’s 2% target. He commented the path has been bumpy with higher inflation and stronger employment in the 1st three months of the year.

    U.S. 10 Year Treasury Note

    Board of Governors
     Source: Board of Governors of the Federal Reserve System (US)     


  • In addition, Chairman Powell recently stated that the U.S. economy and monetary policy is diverging from other developed markets. Powell commented, “The difference between the United States and other countries that are now considering rate cuts is that they’re just not having the kind of growth we’re having.”
  • Low unemployment and strong economic growth in the U.S. means the Fed has the “luxury” of holding interest rates steady for longer to put downward pressure on inflation. Other central banks may be able to declare victory over inflation sooner than the Fed, but they may also have to respond sooner to slower economic growth.
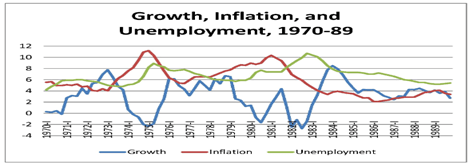
  • While stagflation is rare, it has recently become a more frequent topic of discussion and speculation. Stagflation is a period of stagnant economic growth, persistently high inflation, and rising unemployment, which was the economic environment in the early 1970s.
  • Two of the three conditions may exist today (slowing economic growth and sticky inflation), but the 3rd condition, a sharp rise in unemployment, does not appear to be on the horizon.
  • When Chairman Powell was asked about stagflation recently, he indicated there was no sign of stagflation in the economy. He didn’t “really understand where talk of the stagflation scenario is coming from” given the predominantly strong economic data. We tend to agree.

    Growth Inflation and Unemployment 
     Source: Reed College

Tactical Fixed Income Allocation

  • Overweight to U.S. Large Cap stocks with an emphasis on equities with quality, defensive, and strong cash flow characteristics.
  • Underweight to International Developed with no exposure to Emerging Markets. Although valuations remain attractive relative to U.S. equities, these asset classes may be pressured by a stronger U.S. Dollar and recessionary fears.
  • Slight exposure to gold, to serve as a hedge, in a geopolitically tense global environment.

Equity Market

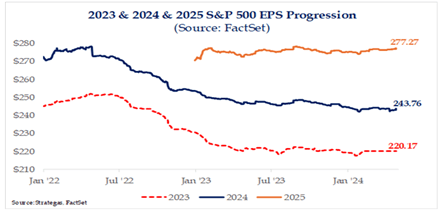
  • S&P 500 earnings per share (EPS) estimates for 2024 and 2025 are holding steady. S&P 500 EPS are expected to increase 11% and 14% in 2024 and 2025, respectively. These estimates reflect continued optimism in market fundamentals.

          
    2023 2024 2025 S&P 500 EPS Progression
         

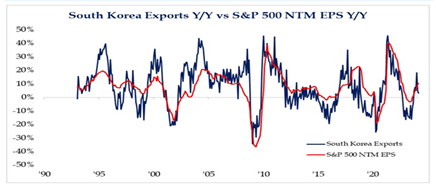
  • South Korean exports, often viewed as the bellwether for global trade, rose 13.8% y/y in April to $56.3 billion, following a 3.1% gain in March, according to the South Korean trade ministry. This marked the 7th consecutive month of export growth for Asia’s fourth-largest economy.
  • South Korean exports have a strong correlation with forward earnings for the S&P 500. With the latest report on South Korean exports, we could expect S&P 500 earnings to remain strong, particularly in the technology sector.


    South Korea Exports
    Source: Strategas Securities, LLC

Tactical Equity Allocation

  • Overweight to U.S. Large Cap stocks with an emphasis on equities with quality, defensive, and strong cash flow characteristics.
  • Underweight to International Developed with no exposure to Emerging Markets. Although valuations remain attractive relative to U.S. equities, these asset classes may be pressured by a stronger U.S. Dollar and recessionary fears.
  • Slight exposure to gold, to serve as a hedge, in a geopolitically tense global environment.
Notices & Disclosures
Past performance is no guarantee of future results. Products and services offered through F.N.B. Investment Advisors, Inc. are not FDIC insured; and are not insured by any Federal Government Agency, are not deposits or obligations of or guaranteed by First National Bank of Pennsylvania or its affiliates and may go down in value. The material has been extracted from various sources that F.N.B. Investment Advisors, Inc. believes reliable, but we cannot guarantee the accuracy or integrity of the material. This material is for your private information, and we are not soliciting any action based upon it. Any projections, market outlooks or estimates contained herein are forward-looking statements and are based upon certain assumptions. Other events that were not considered may occur and may significantly affect the returns or performance of these investments. Any projections, outlooks or assumptions should not be construed to be indicative of the actual events which will occur. These projections, market outlooks or estimates are subject to change without notice. Different types of investments involve varying degrees of risk, and there can be no assurance that the future performance of any specific investment, investment strategy, or product or any non-investment related content, made reference to directly or indirectly herein will be profitable, equal any corresponding indicated historical performance level(s), be suitable for your portfolio or individual situation, or prove successful. Due to various factors, including changing market conditions and/or applicable laws, the content may no longer be reflective of current opinions or positions. You should not assume that any discussion or information contained herein serves as the receipt of, or as a substitute for, personalized investment advice. To the extent that a reader has any questions regarding the applicability above to his/her individual situation of any specific issue discussed, he/she is encouraged to consult with their investment advisor. You can review your registered investment advisors or the investment advisory firm at the SEC's Investment Adviser Public Disclosure page - http://www.adviserinfo.sec.gov/IAPD/Default.aspxRedirect icon.

Redirect icon - For your convenience, First National Bank (FNB) provides links to third party service providers. By clicking this link you agree to leave FNB’s website and will be routed to a third party site outside the control of FNB. FNB does not provide, and is not responsible for, the products, services, or overall website content available at a third-party site. FNB does not endorse or guarantee the product, information or service on any third party’s website. FNB’s privacy policy does not apply to the linked website; we encourage you to read and evaluate the privacy and security policies of the site you are entering.
0 items in your cart

Cart Proceed to Checkout

Product video